Hammer Candlestick Pattern: How to Spot It and Trade It
By Bharat · July 5, 2026
The hammer is one of the first reversal patterns most traders learn, and one of the most misused — usually because people learn the shape without learning the context it needs to mean anything.
What a hammer looks like
- A small body near the top of the candle's range.
- A lower wick at least twice the length of the body.
- Little to no upper wick.
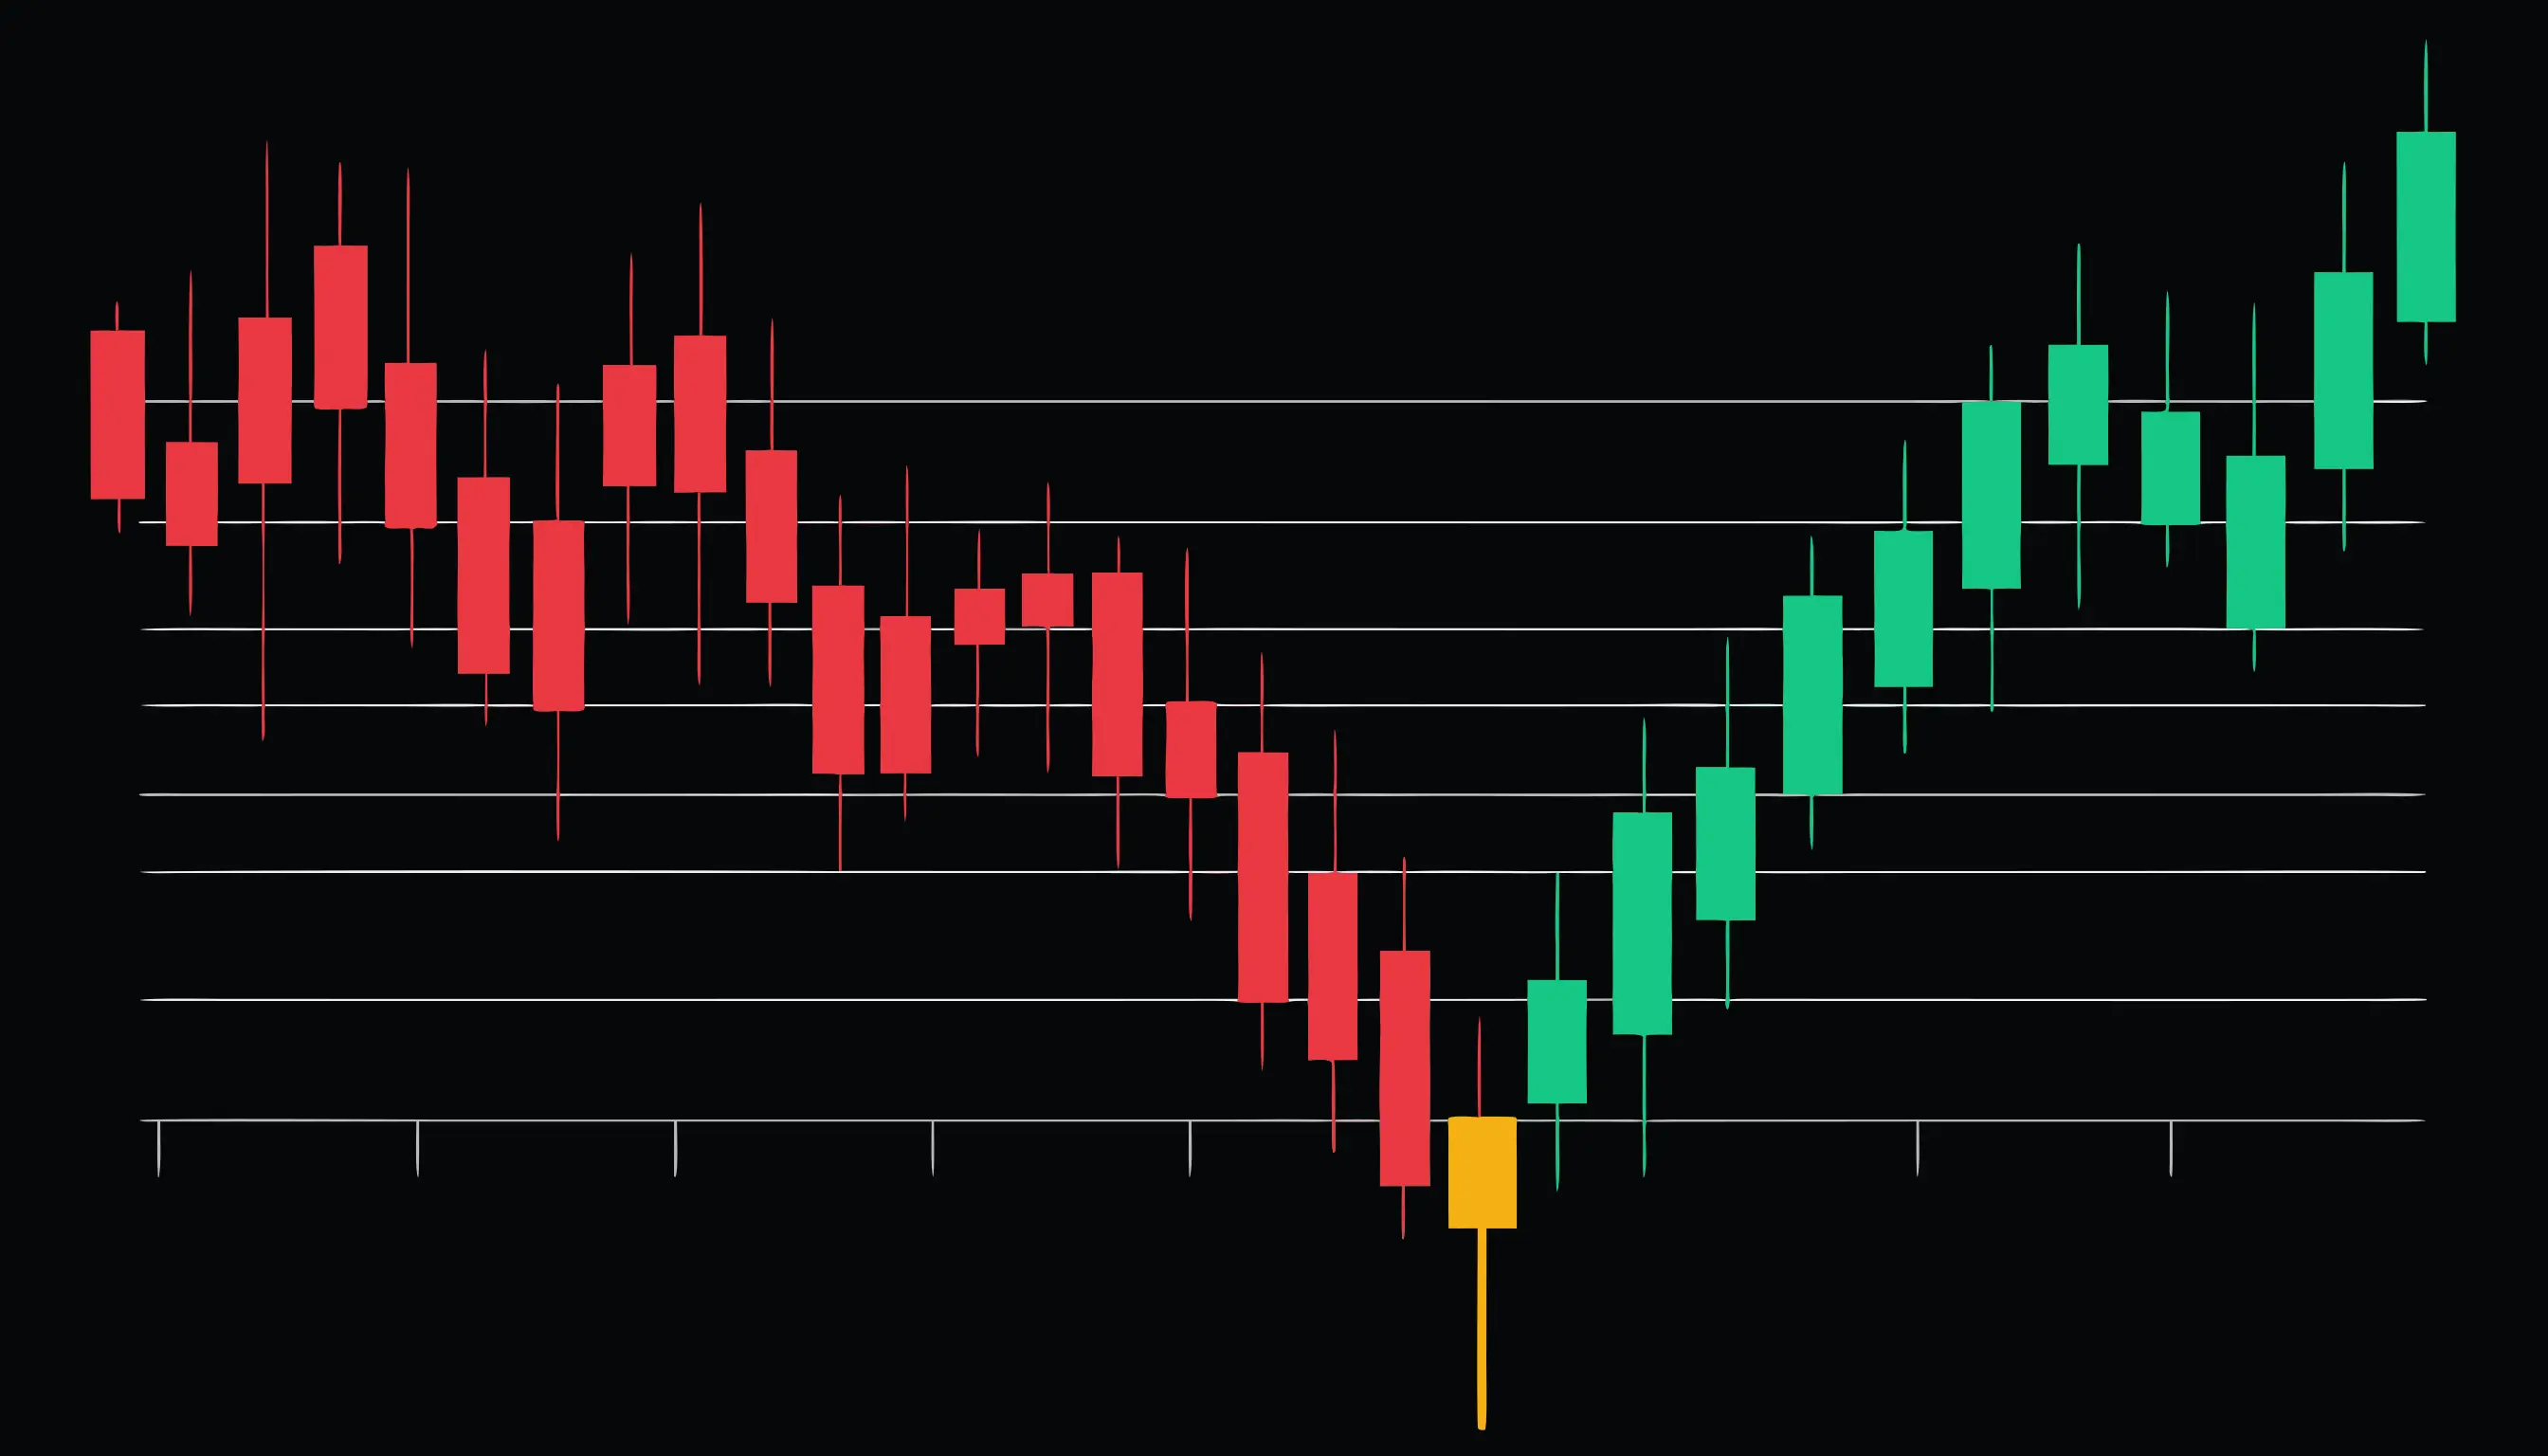
- It appears after a clear downtrend — this part is not optional.
The shape tells a specific story: price opened, sellers pushed it well below the open during the session, and then buyers stepped in hard enough to drag it back up near where it started before the close. Sellers were in control for most of the period and lost that control by the end.
Why the downtrend matters
The exact same candle shape sitting in the middle of a sideways range, or partway up an uptrend, is not a hammer in any useful sense — it's just a candle with a long lower wick. The pattern's name and meaning both depend on it showing up after a stretch of falling price, where a rejection of new lows is actually informative about who's left to sell.
What confirms it, and what doesn't
A hammer is a candidate for a reversal, not a confirmed one. What tends to matter more than the hammer itself:
- The next candle. A strong green candle closing above the hammer's high adds real weight. A hammer followed by another red candle just means the selling continued.
- Volume. A hammer on unusually high volume suggests real buying interest, not noise.
- Where it forms. A hammer at a level that was already a prior support zone carries more information than one in open space.
The failure mode to watch for
The most common mistake is treating the hammer itself as the entry signal. On its own, a hammer is one candle's worth of evidence in a market that generates thousands of candles. Waiting for the next candle to confirm the shift — and sizing the position so a false signal doesn't cost more than it should — is the difference between using the pattern and gambling on it.
Ready to put this into practice?
Structured courses on price action, options, and risk management.
Browse courses