
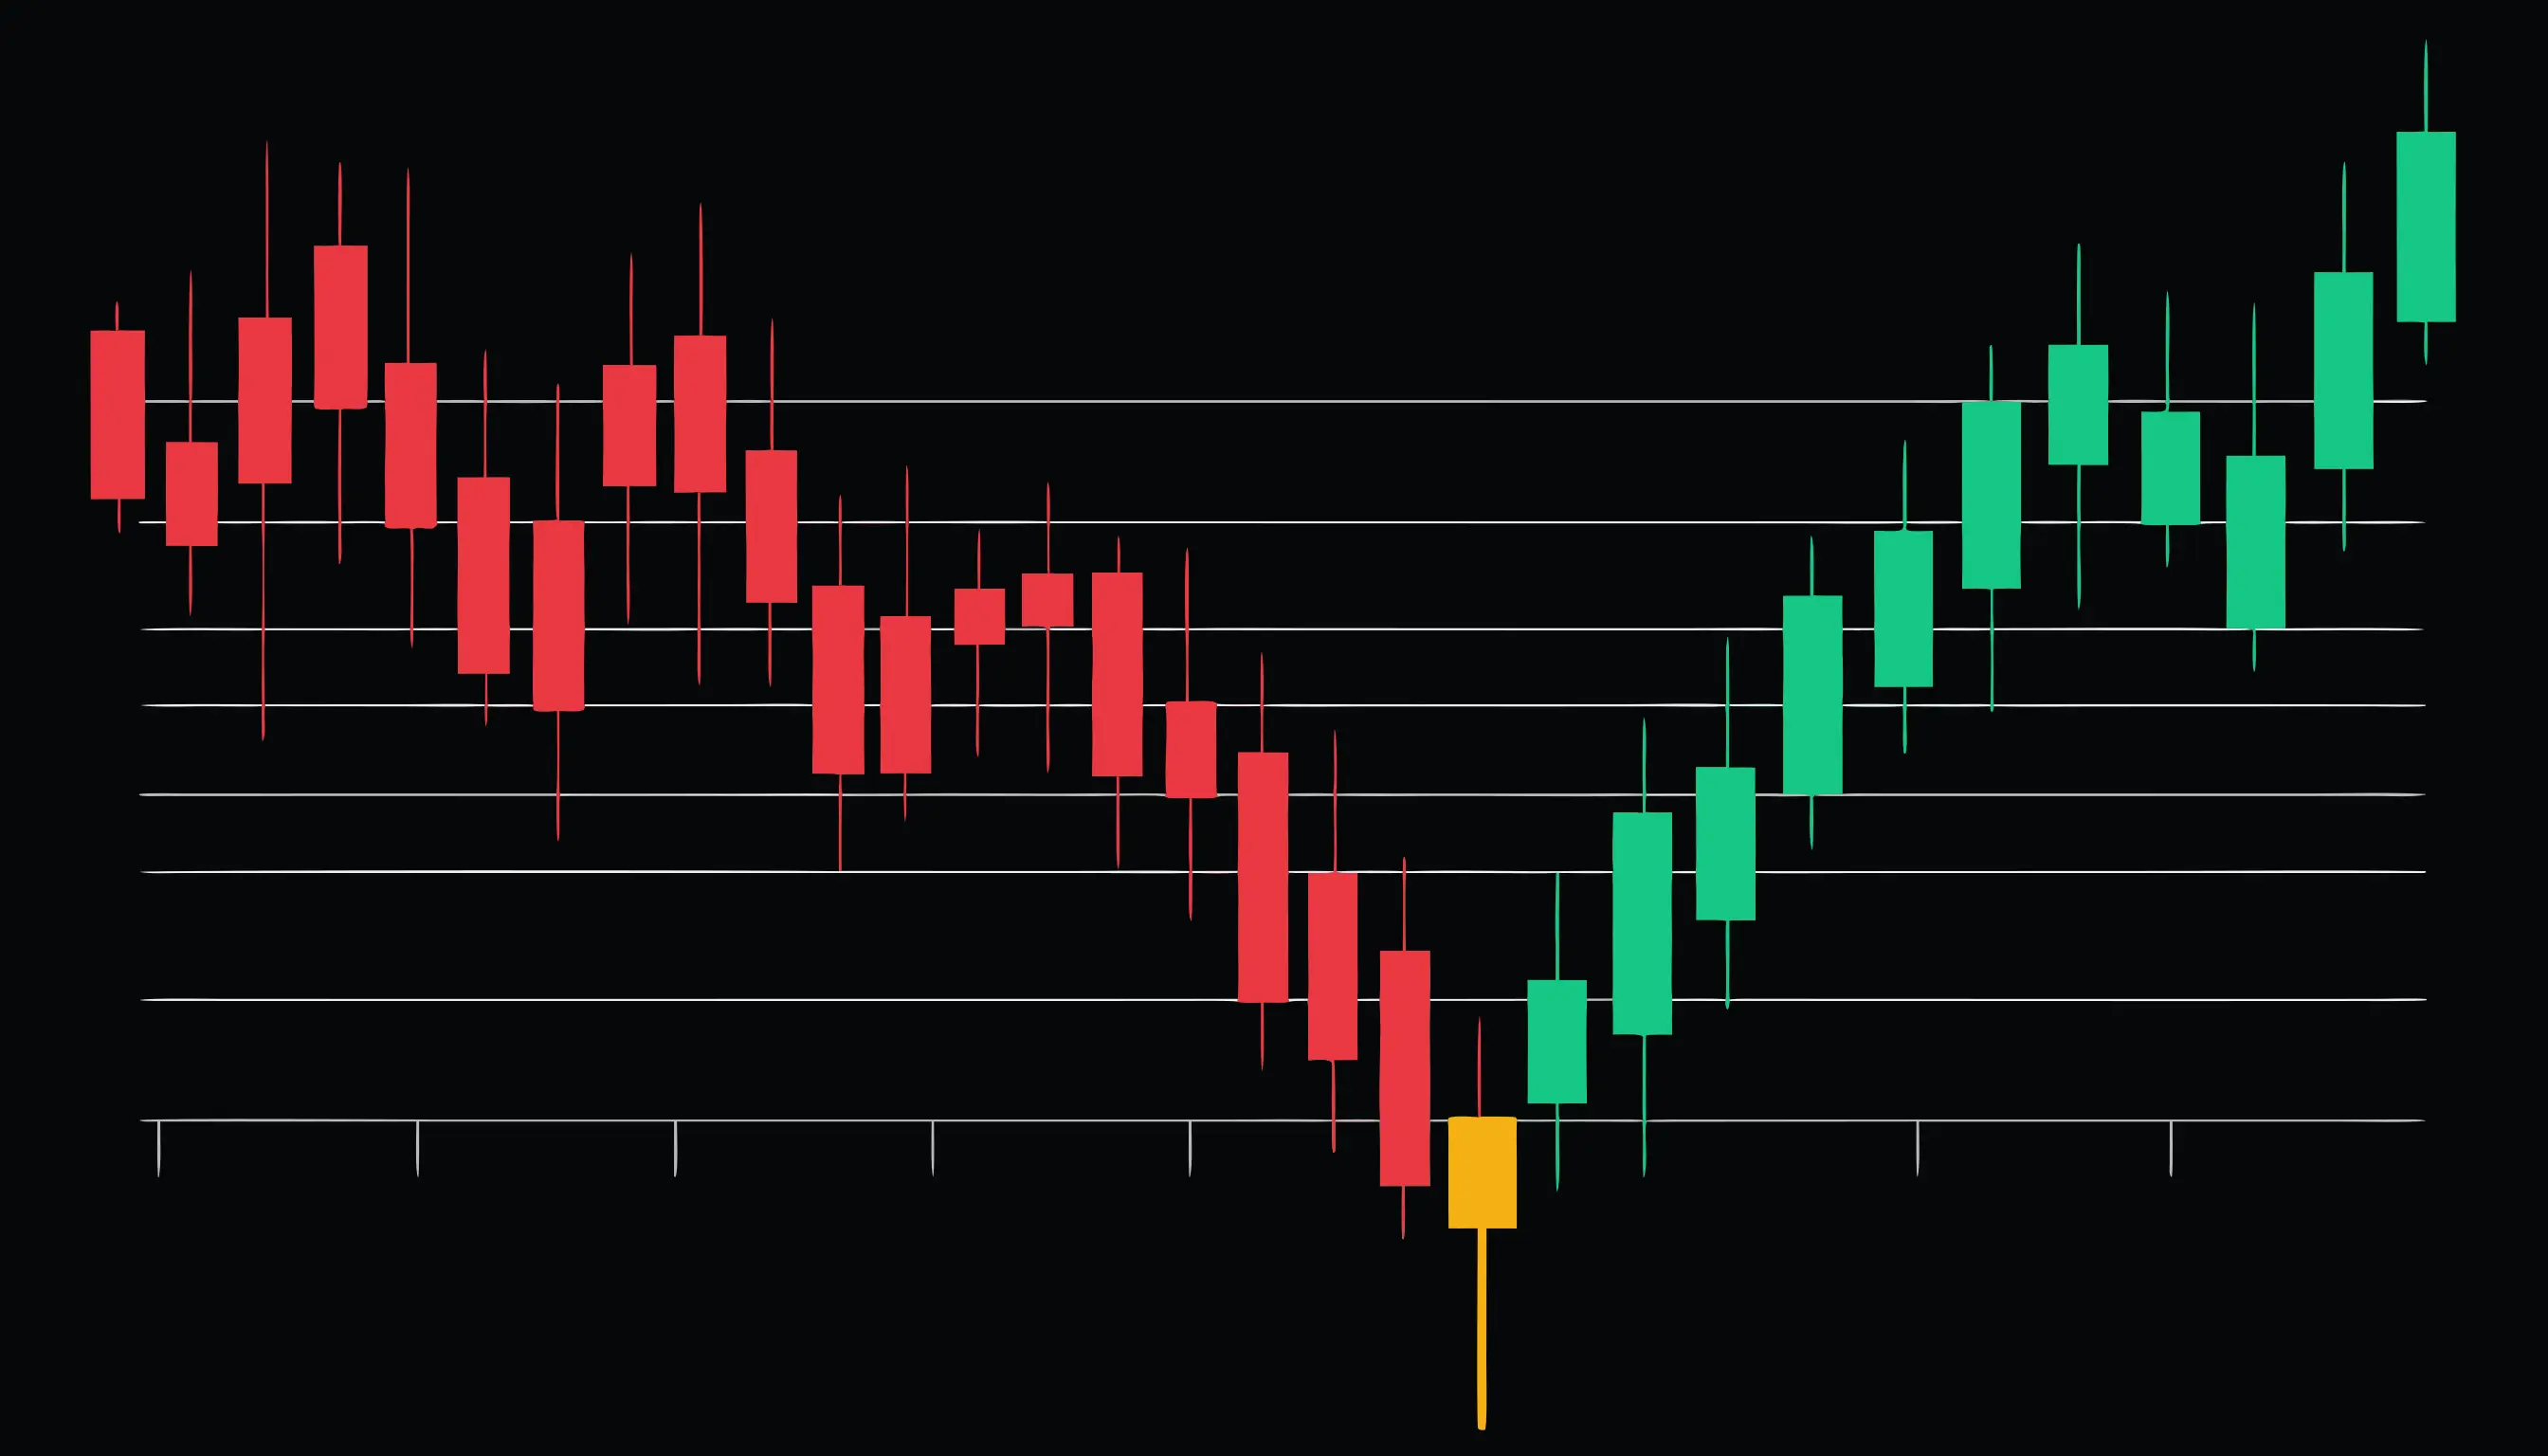
Double Bottom Pattern: How to Spot It and Trade It
The double bottom is the double top's mirror image — two troughs at the same level, marking support that held twice at the end of a downtrend.
Jul 5, 2026

Double Top Pattern: How to Spot It and Trade It
Two peaks, one resistance level that held twice — the double top is a simpler cousin of the head and shoulders, and just as widely watched.
Jul 5, 2026

Head and Shoulders Pattern: How to Spot It and Trade It
Three peaks, one higher than the other two — the head and shoulders is one of the most recognized reversal patterns in trading. Here's how to read it correctly.
Jul 5, 2026
Chart Patterns in Trading: The Complete Guide
Chart patterns are the shapes price leaves behind over weeks and months, not single candles. Here's how they differ from candlestick patterns — and which ones to learn first.
Jul 5, 2026
Shooting Star Candlestick Pattern: How to Spot It and Trade It
The shooting star is the hammer's bearish twin — it forms at the top of an uptrend and often marks buyers losing their grip.
Jul 5, 2026
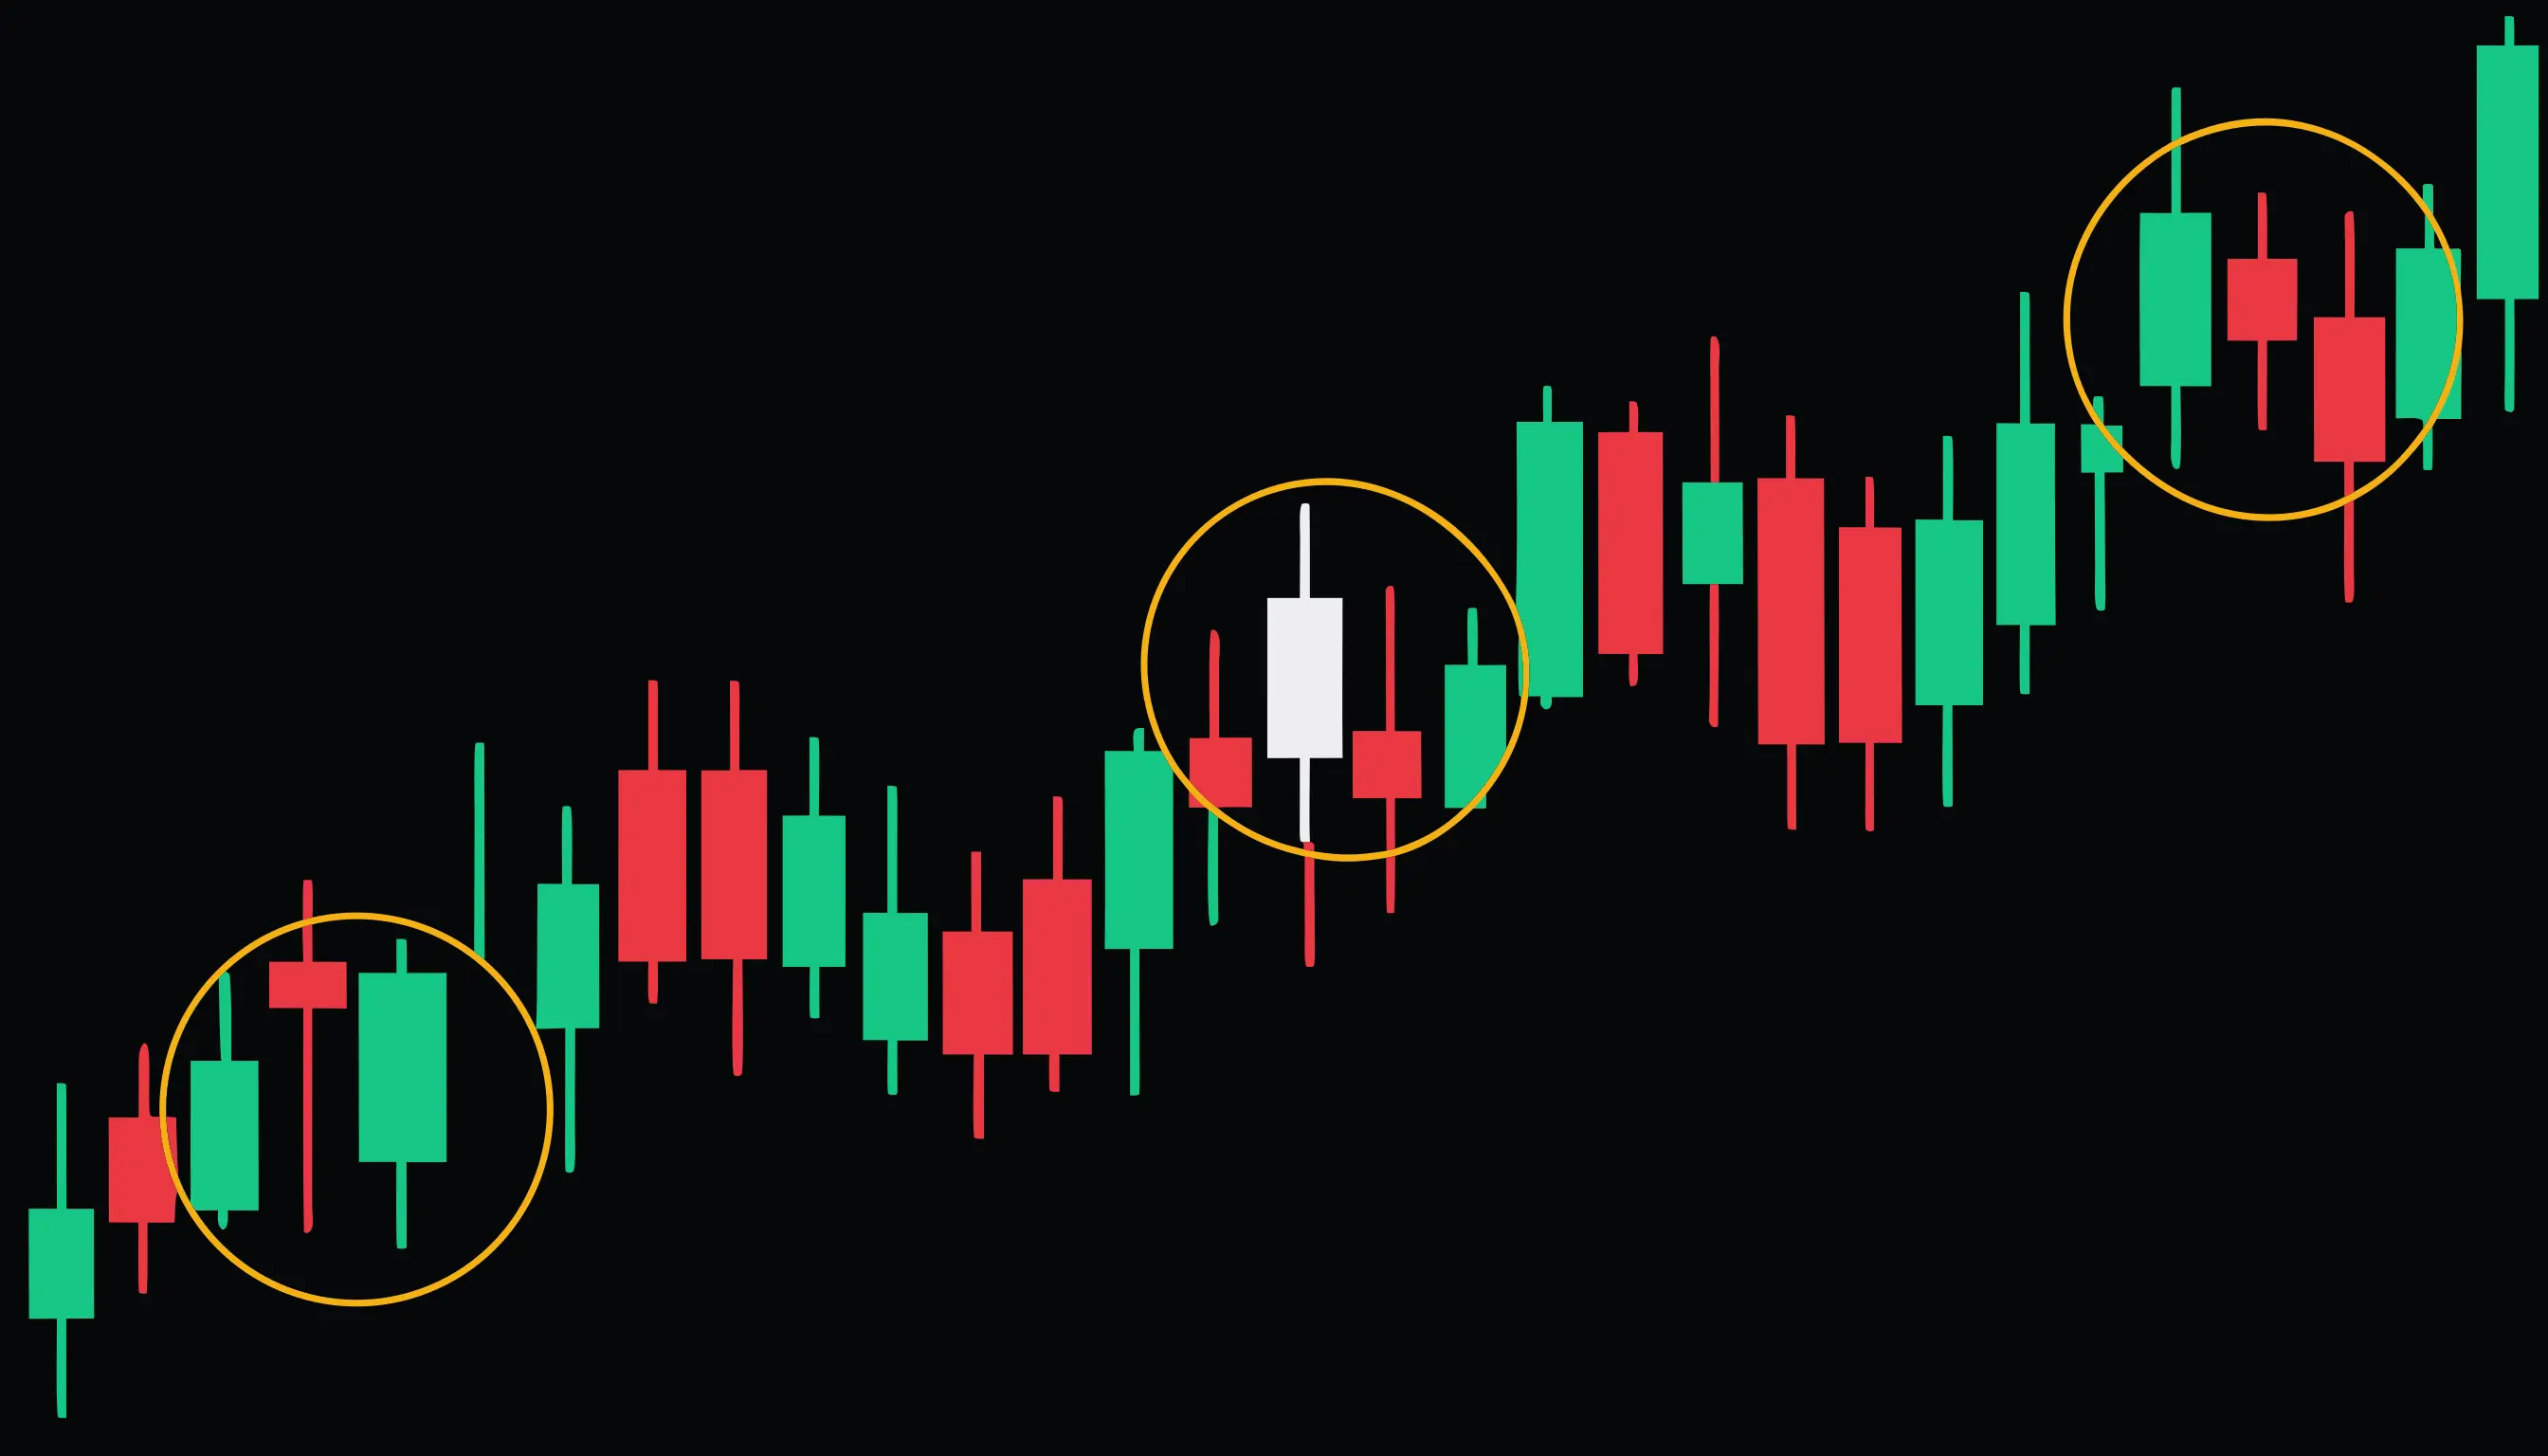
Spinning Top Candlestick Pattern: What It Signals
A spinning top has a small body and long wicks on both sides — a visible tug-of-war that ended in a near-tie. Here's how to read one.
Jul 5, 2026
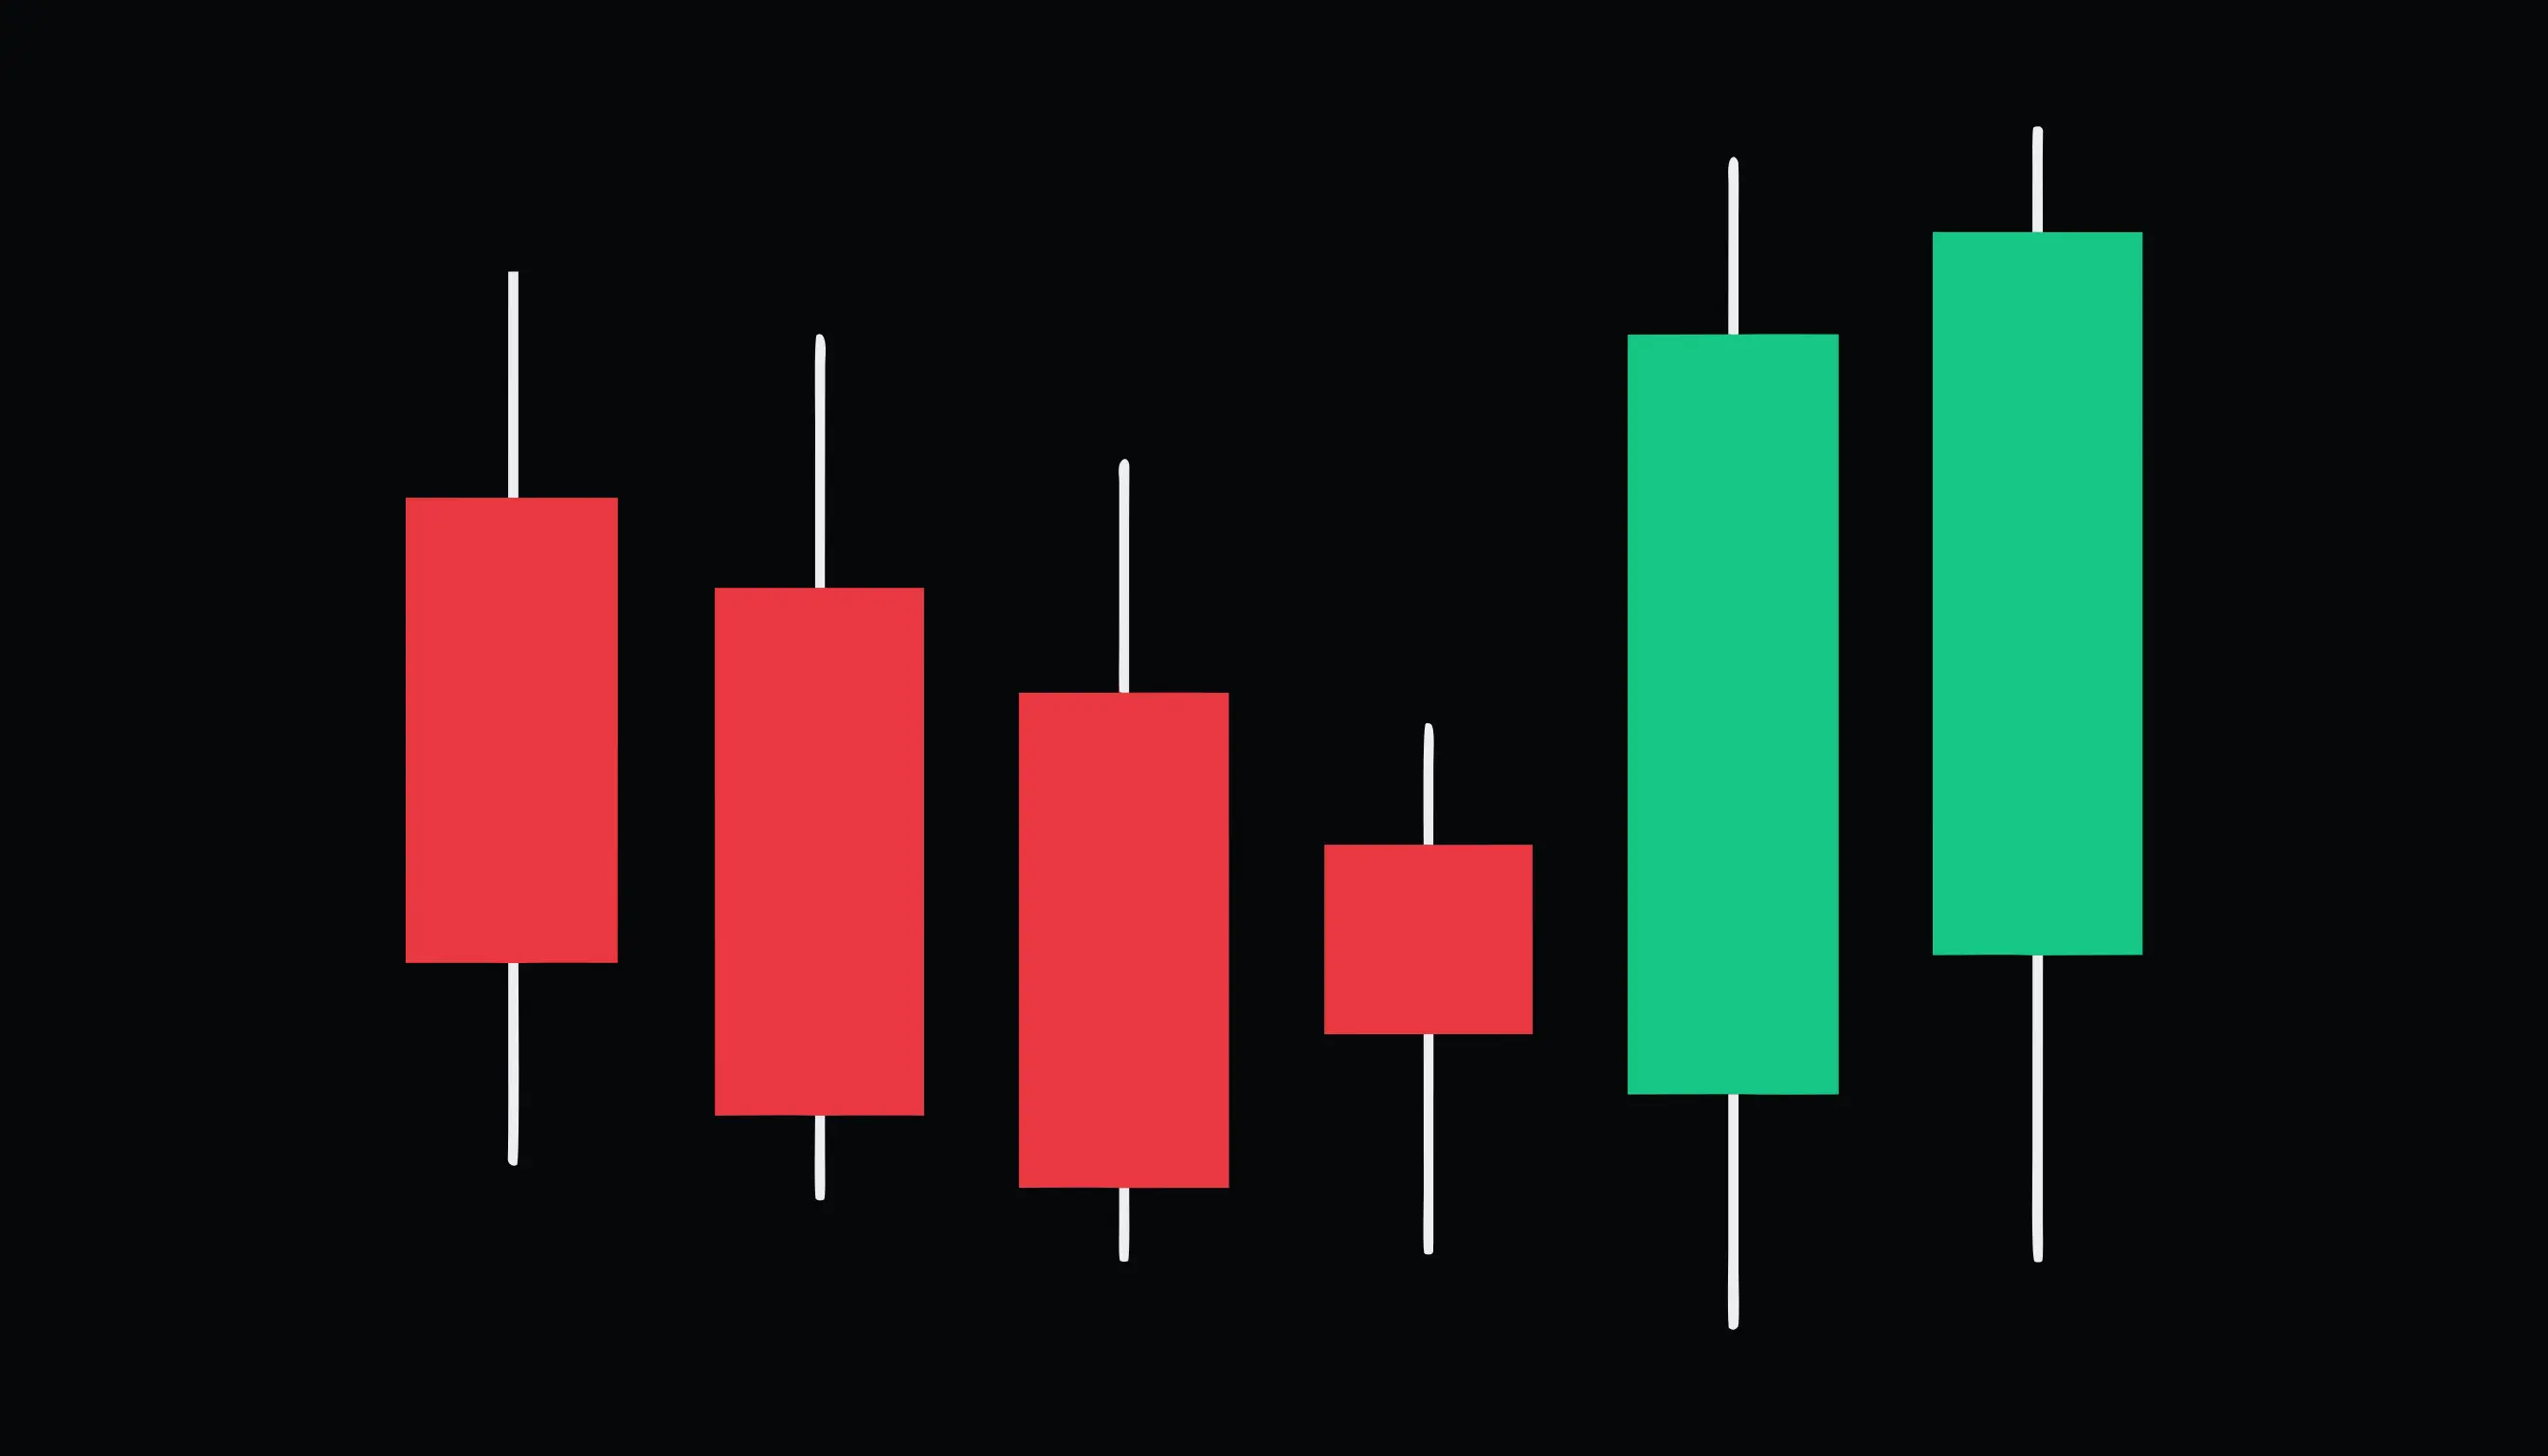
Bearish Engulfing Pattern: How to Spot It and Trade It
The mirror image of the bullish engulfing pattern — a large red candle swallowing the green candle before it, often at the top of a rally.
Jul 5, 2026
Bullish Engulfing Pattern: How to Spot It and Trade It
A bullish engulfing pattern is one candle completely swallowing the one before it. Here's why size and context both matter more than the shape alone.
Jul 5, 2026
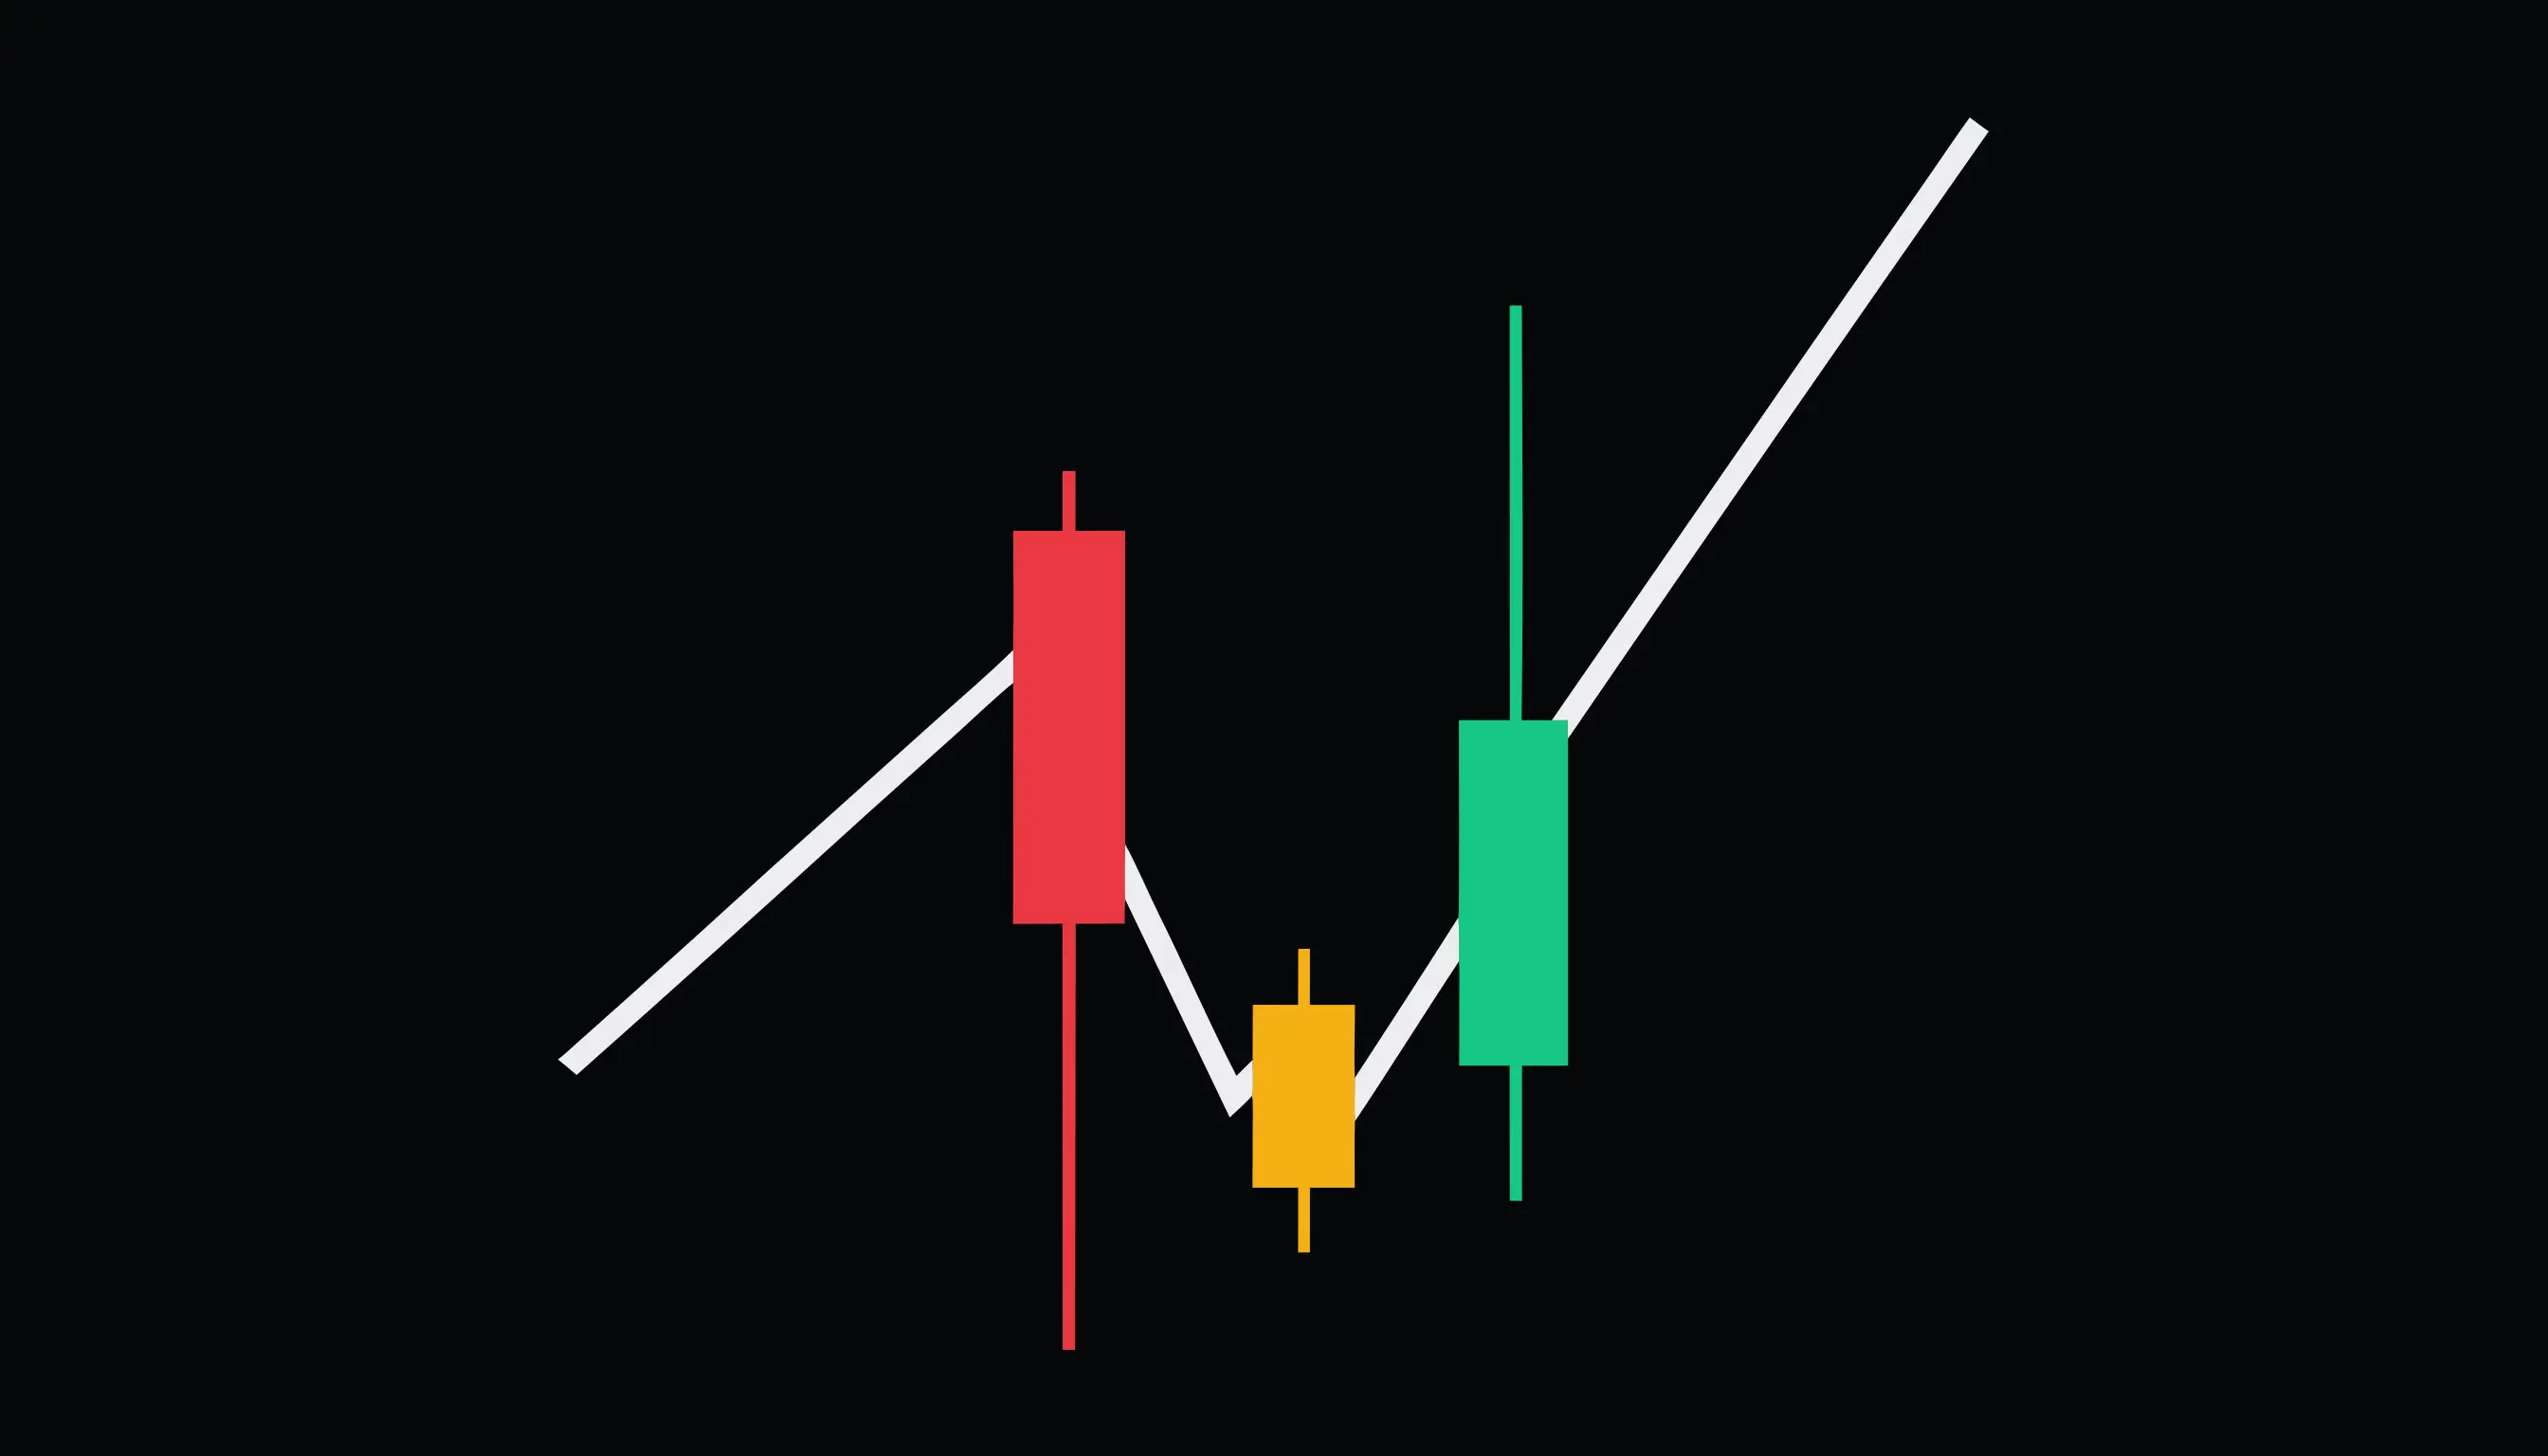
Morning Star Candlestick Pattern: A Complete Guide
The morning star is a three-candle reversal pattern that shows up at the bottom of downtrends. Here's how each candle earns its place in the formation.
Jul 5, 2026
Doji Candlestick Pattern: What It Means and How to Trade It
A doji shows indecision between buyers and sellers. Learn how to read one in context instead of trading it blind.
Jul 5, 2026
Hammer Candlestick Pattern: How to Spot It and Trade It
A hammer forms after a downtrend and often signals buyers stepping in. Here's exactly what to look for — and what a hammer does not guarantee.
Jul 5, 2026
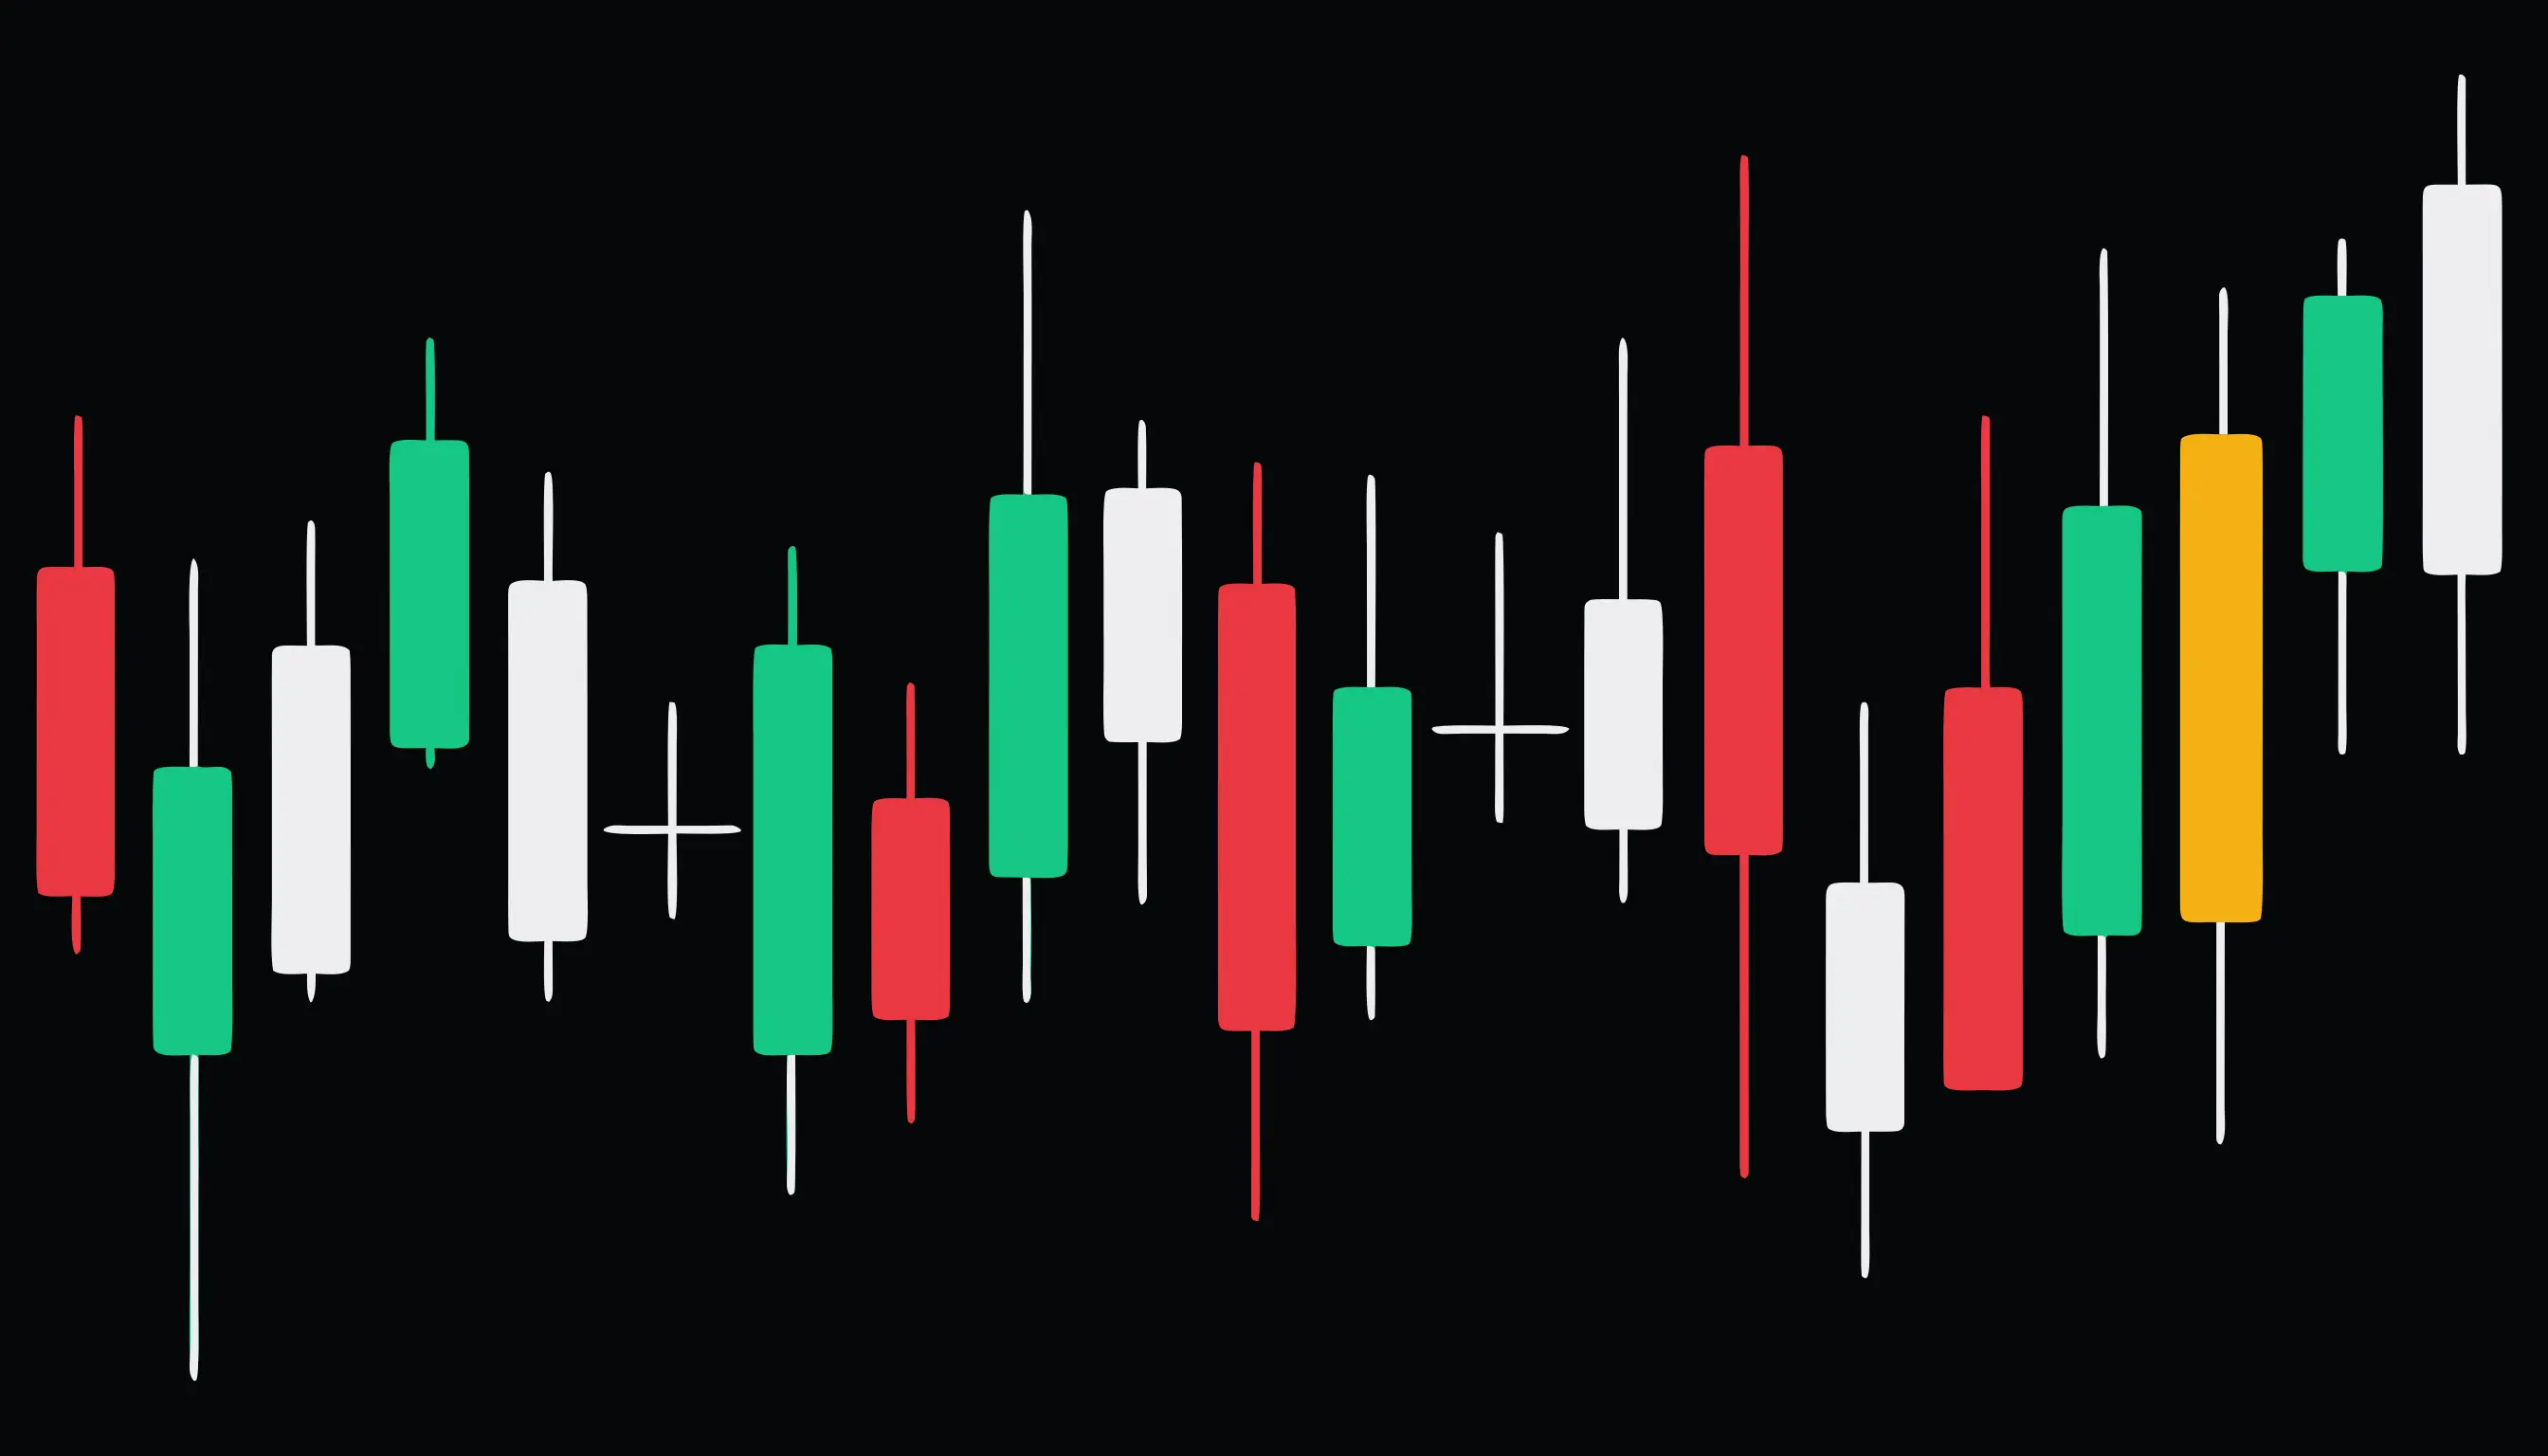
Candlestick Chart Patterns: The Complete Beginner's Guide
What candlestick patterns actually tell you about a stock's price action — and the handful that are actually worth learning first.
Jul 5, 2026